 Web Log Storming
 CD Label Designer
 MicroBiz Balance
  Grocify
 Agenda At Once PIM
 Decision Oven
 Software Development
 Web Design and Programming
 Examples of our Work
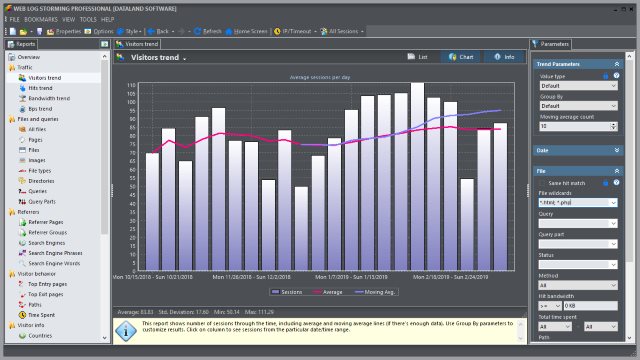


Recently I found few interesting questions about how to track custom variables with Google Analytics. The question well makes sense, even if your website is not a complex web application that your visitors log in to. “Simple” showroom websites could benefit from such kind information too, providing that you want to learn more about visitor behavior grouped by data not already included in stats. Here’s an example of how you can do this with Web Log Storming, but you might apply similar steps if you use some of other tools too.
Let’s say that you run online shoe-shop. At some point, you decide to present a simple survey to your visitors and put results into cookie information. In this case, you would probably be interested in demographic information such is gender, age, marital status, etc.
Disclaimer: I’m completely ignorant about selling shoes (Al Bundy would probably know better), so don’t mind if I completely missed what matters in this business. 🙂
Setting up a website
Step 1. Building a survey
 First thing you need to do is to actually build a survey. How to do that is beyond scope of this article, so I’ll leave it to you. But all surveys have something in common: they contain questions. Let’s say that questions for this example are:
- Gender (Male / Female)
- Age (20-ies / 30-ies / 40-ies / 50-ies / 60-ies…)
- Marital status (Single / In relationship / Married / …)
You get the picture. Put answers into a cookie and you’re ready for the next step.
Step 2. Logging this information
If these individual answers stay in visitor’s local cookies, you won’t be able to use them. It’s actually easy to “trick” a web server to write them down for you, and here’s how.
First, create a transparent 1×1 pixel gif image and upload it to your server (for example: myvars.gif). For your convenience, you can get one from here (right-click on link and save image).
Now change your web pages (or just one of them, depending how your website is organized) to include code into header or footer, similar to this:
<img src="/path-to/myvars.gif?g=<?php $_COOKIE['gender']; ?>" />
<img src="/path-to/myvars.gif?a=<?php $_COOKIE['age']; ?>" />
<img src="/path-to/myvars.gif?s=<?php $_COOKIE['status']; ?>" />
You would probably want to replace $_COOKIE[ ] parts with your functions, but we’ll keep it as simple as possible here.
These images will be invisible to visitors, but your log files will from now on contain lines like these:
1.2.3.4 [18/Oct/2009:22:20:06 -0600] "GET /myvars.gif?g=female HTTP/1.1" 200 ...
1.2.3.4 [18/Oct/2009:22:20:06 -0600] "GET /myvars.gif?a=40 HTTP/1.1" 200 ...
1.2.3.4 [18/Oct/2009:22:20:06 -0600] "GET /myvars.gif?s=married HTTP/1.1" 200 ...
Note the emphasized parts behind question marks. Instead of placing an image for each variable separately, you can combine them into one request, so your get ?g=female&a=40&s=married. It’s up to you how you want to track them later.
Now we only need to extract these into a meaningful statistics.
Extracting and analyzing custom variables
As I said before, it might be possible to analyze this info with other products (although often with limited possibilities), but here we’ll show how you can do that with Web Log Storming. For purely selfish reasons, of course. 🙂
 First, you can use Queries report to see how popular each survey option is. If you define your Goals in this report you’ll also be able to see how well each of visitor groups convert.
Next and even more important, you can set up a Query parameter to focus on specific groups and analyze them separately. With Web Log Storming it’s really easy to do that (see the screenshot):
- Type a filter into Query parameter (for example: “a=40”) and hit Enter. Whatever report you have active at this moment, it will now be based on visitors in forties only.
- Optionally, click Lock button to base all other reports you select on the same set of visitors, until you explicitly remove this filter.
It’s simple as that, but there’s more possibilities for advanced filtering by combining more than one group, comma separated. Here are few examples as an illustration:
- s=married, s=relationship
All visitors either married or in a relationship - s=married, s=relationship, +g=male
All male visitors either married or in a relationship (note the “+” sign) - g=female, -s=divorced
All female visitors who are not divorced (again, note the “-“ sign) - +a=30, +s=divorced
All divorced visitors in their thirties
There are numerous combinations and possibilities, and for more info how wildcards work in Web Log Storming, check this page in the user manual.
Note: if you decided to combine all variables into one request (ie. ?g=female&a=40&s=married), you’ll need to enclose filters in wildcard (asterisk) character, like this: *a=40*, +*g=male*.
How to use these insights or “Why should I care”?
Common sense tells us that our website should “push” male shoes to males and female shoes to females, right? But is it possible that it’s not the best choice? What if your analysis show that married middle-aged males often buy shoes to their spouses as a gift? You would definitely want to make it easier for them to do so.
Or maybe you discover that divorced people, regardless of age, are more likely to buy more expensive shoes, so shouldn’t you present them an appropriate offers? Or maybe this doesn’t apply to divorced people in their sixties? Maybe people in sixties are generally not interested in expensive shoes, regardless of marital status?
There is lot of questions which all make sense to me, but I’ll just stop – if someone told me month ago that I will spend this much time thinking about shoe market… 😉 Besides, I’m sure you understood the importance of visitor segmenting buy now and that you know what questions relate to you business.
Links
Web Log Storming website
Web Log Storming 30-day trial download


